|
Greetings from the Northwest! July is upon us, and the forecast here is for some very Summery days ahead with temps in the mid-nineties. With that, we’re coming into what has traditionally been a slower season for security markets and many businesses, with folks nationwide taking advantage of the good weather to travel or enjoy their homes and families. At Cairn, the incoming calls have dropped off quite a bit, and are most likely to be about pulling a little cash for home improvements or travel. As usual, we’re cycling through a few staff vacations here, but will always have someone available to take your call and move funds or make a trade if the markets and banks are open. Despite the predictable lull in business activity, this year has some underlying circumstances that make it unique and interesting. For one, it’s an election year. I hardly go for an hour without someone pointing this out. With each passing week the intensity of the media storm on this topic is increasing, with no respite likely until late in the year. Many people worry about the possible election outcomes and how their lives, finances, investments and the future health of the nation could be affected. Our job is to see to it that no matter what happens in November, our clients’ investments survive the experience, and, if possible, thrive. On our side is the fact that election years tend to be good for the stock market; this is not intuitive, but historically the markets have advanced, regardless of who wins. Since 1960, only 3 of 16 elections have coincided with a down market. We’ve also got a bit of a tailwind with our positions in fixed income and cash, both of which are paying much higher rates than just a couple of years ago; and the fixed income is better positioned to act in its traditional role as a counterbalance to stocks and is less subject to interest rate shocks going forward. Every year, and every election year, is different, and many other realities are in play. Inflation has subsided but is not yet back where the Fed, and most of us, want it to be; mortgage rates are high relative to the past decade or so, and with house prices as high as they are, this has put the market for existing homes in quite a bind. People simply cannot afford to buy an equivalent house if they choose to sell the one that they’re in. This chart (below) illustrates the difference between the average rate of existing mortgages (loans outstanding) and the current rates. This has resulted in fewer existing homes for sale and has greatly benefited new home builders, who can offer homes at just the right price point, along with preferential financing. A possible longer-term outcome will be a sideways or down market for several years as folks just stay put, and when they do move, they can afford less of a home. Other things in play include massive public debt at much higher interest costs, a thinly supported stock market and generally high valuations. On the bright side, people seem to be going about their lives and spending money, and the US economy still shines above all others. One last thing before I hand this to Patrick for an in-depth discussion: Please remember that we have your back when it comes to financial planning of pretty much any sort, with broad expertise, multiple certifications, and best in class tools; we can work with you, at no additional cost, to develop and implement a plan for your future needs. Contact anyone at Cairn to get started. Now on to Patrick: Patrick's PartEquity markets had a mixed 2nd quarter as US stocks continue to be led by just a few select large technology companies. The table below summarizes the returns of the major indices for the quarter. As you can observe from the table above, outside of the S&P 500 and Nasdaq, most major indices were negative, which might not be intuitive given the media’s regular mentioning that stocks are hitting all-time highs. The previous few quarters, I have written about inflation, Fed rate cut decisions, investor sentiment, and equity valuations. I am not going to touch on the economic backdrop, which remains mixed, but focus this letter solely on what is driving equity market returns, what that could mean moving forward, and how we are navigating this challenging environment. As we go through the charts below, the major takeaway will be waning market participation (breadth) being masked by a few large tech companies despite lofty or extreme valuations. The chart above takes the equal weight version of the S&P 500 and divides that into the traditional (market cap weighted) version of the S&P 500. When the line is moving down, fewer stocks are driving the returns of the S&P 500 which is generally not a healthy market environment. Historically, sustained bull markets are accompanied by broad participation across sectors and asset classes. The current level of this ratio is at a 16-year low, and as you can also see from the chart, prolonged downturns in this ratio have preceded some nasty bear markets in the past in 2000, 2007 and 2020. As the market continues to make new highs, fewer companies are trading above their respective 200 day moving averages, which signals more companies’ prices are entering a downtrend than an uptrend. As we have witnessed in other reflection points in the market. With the tech sector growing to over 30% of the S&P 500’s weighting, similar to 1999, it is even more glaring when you compare the price performance of the S&P 500 Equal Weight Index versus the S&P 500 Information Technology Sector Index. Year-to-date performance of the different S&P 500 sectors confirms that most sectors are showing mid-single digit gains. The same can be said when looking at asset class performance. Investors piling into mutual funds or passive ETFs that follow or overweight these popular sectors are taking on much more risk than they probably realize. I think of it as momentum chasing with little regard to the price being paid for the underlying fundamentals. Recently in the Wall Street Journal, a chief investment officer of a well-known brokerage firm was quoted as saying, “Tech allows you to play defense and offense at the same time.” I find this difficult to believe. Tech has a trailing p/e ratio of 43x, a forward p/e of 34x, a combined price to sales ratio of over 13x, and we are late in a cycle with euphoria at very high levels for that given sector. Valuations in the US are also reaching extremes when you compare them to the rest of the world. The chart above shows the S&P 500 price / sales ratio divided into the rest of the world’s price / sales ratio. There have only been a few times over the last 27 years when we have reached this level of relative overvaluation. SummaryEquity market returns have been largely positive this year and over the last twelve months; but the outsized returns that are being shown in select indices are being driven by just a handful of names that are trading at historically high valuations. We feel this brings a high amount of risk to chasing those names as well as to the broader market. Speculators seem to believe that no price is too high and that they will be able to time the exit from the party before everyone else rushes for the door. This is almost impossible to accomplish on a consistent basis. As investors, we believe in understanding the price we are paying for the underlying fundamentals of the business and asset class, then paying a price we believe is below the value of what the market is offering it for. This does two things: It provides more downside protection than buying overpriced assets if the market falters, or we end up being wrong (which happens occasionally), and it produces a long-term return sufficient to meet your goals. Ignoring the noise and focusing on process is essential for navigating expensive equity markets. Currently, we are still invested below our long-term equity targets across all asset allocation strategies. We are still finding some limited opportunities, but the data guides us to still have a higher-than-normal cash balance. When the facts change, rest assured, we will change our mind and will have the flexibility to deploy cash without having to sell other assets that have declined in value. Thank you again for your continued support and trust. I intend my section of the newsletter to be informative and to give you a glimpse into what we are looking at daily. Please feel free to reach out to me if you want to discuss any topic in more detail. —Patrick Mason Thanks, Patrick! As always, a well thought out analysis of some important factors affecting our markets.
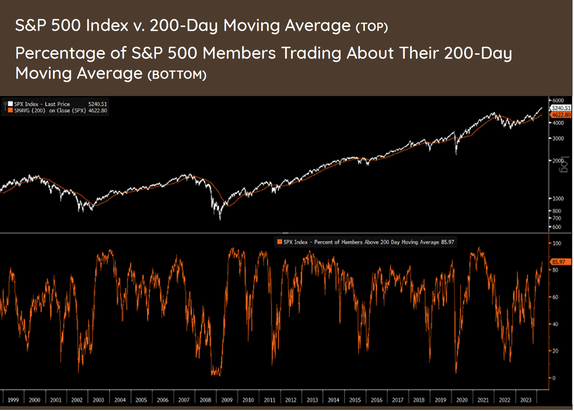
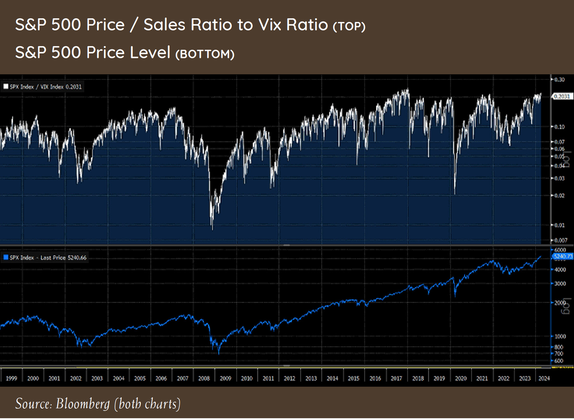
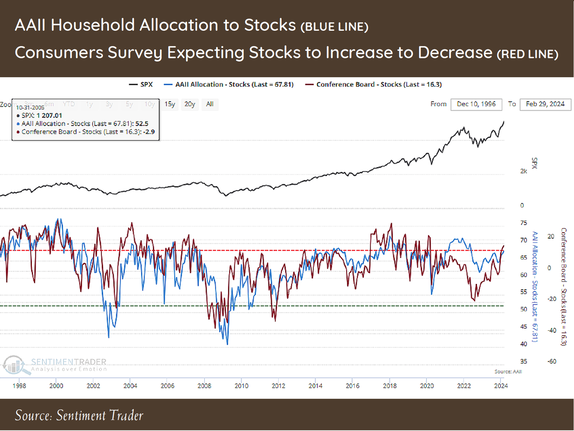
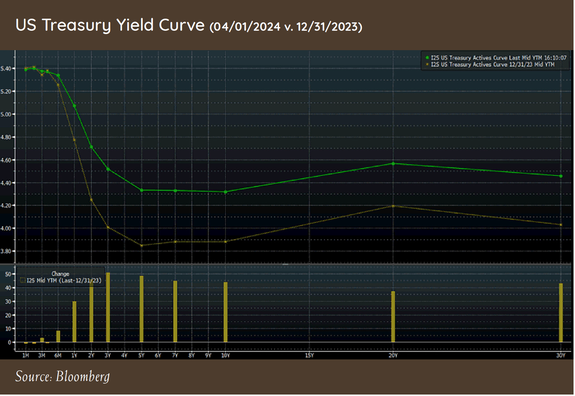
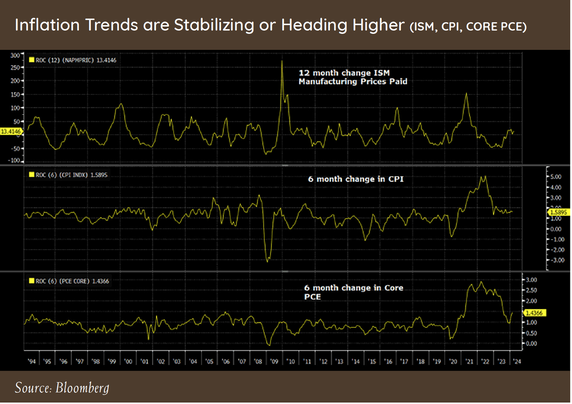
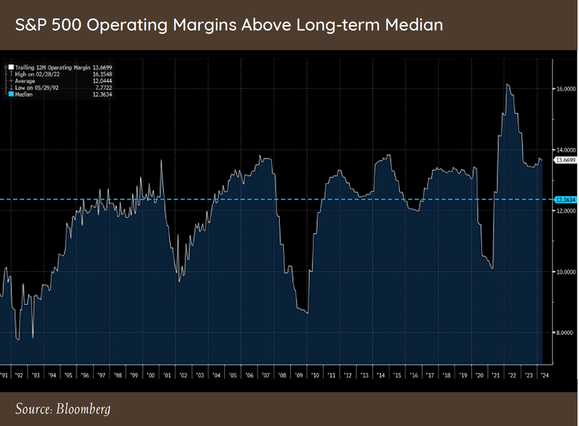
I hope everyone has a safe and fun summer. If you’d like to come in to review your accounts or your long-term plans, please give Stefanie a call, and she’ll get you scheduled with your advisor. Tim Mosier, President Cairn Investment Group, Inc. Greetings from the Northwest! Well, it’s been quite a first quarter for 2024! Against a backdrop of multi-faceted turmoil, the US economy has been strong enough to avoid a recession, despite last year’s spike in interest rates and enduring inflation. Apparently, consumers are still spending, even if it means getting deeper into debt, which may indicate a sense of optimism about their prospects, or it could be a house of cards ready to fall. We’ll see. Stock market indexes outperformed most expectations, but still, we saw that the broader market was not as enthusiastic as the few market leaders, although this last month saw that broader market catch up a bit; a healthy move. The “Magnificent Seven” is now the “Fab Four,” with Apple and Tesla in particular underperforming of late. A much-desired outcome for the Fed and most investors is the elusive “soft landing” whereby a major economic shift occurs (in this case, raising the Fed rates), without driving the economy into recession. I think it’s arguable that they’ve achieved that goal, recognizing that we never actually land anywhere; the merry-go-round never stops, and someday, due to some set of circumstances, we will experience a recession. Inflation is not yet in the bag either. We can’t yet predict the combined effect of having the Suez Canal route compromised and the upper Chesapeake out of service at the same time. I’ve heard it argued that we’ve been experiencing a “rolling” recession, with economic sectors taking their turn getting hit, then recovering, with the net result that overall, we never dip below the line. I can believe that. We’ve moved past the bank scare we were talking about last year at this time, but it may not all be over, especially for regional banks that have lent heavily into the commercial real estate market. I probably don’t have to tell you much about the state of that market for you to understand the risk presented. We have little to no exposure there, so hopefully whatever transpires won’t spread much beyond that sector. We’re happy to welcome Spring, and with the better weather, more of you are wanting to come in for an in-person meeting! I highly encourage it. Just give us a week or two’s notice and we can be prepared. Before moving on to Patrick’s well thought out dissection of the financial world, I’ll mention that we now have the ability to actively manage your 401(k)s and similar assets that cannot be brought into Schwab at this time. We’re utilizing a software service by Pontera that allows us access to almost any employer retirement plan. The advantages to you are our ability to coordinate those investments with your overall strategy and relieve you of the need to stay on top of rebalancing and allocation changes. Dan, Mark, or Patrick can explain how to set this up if it makes sense for you. With that, here’s Patrick: Patrick's PartEquity markets continued the upward trend that started in November last year, with most stock indexes posting mid to upper single digit gains for the quarter. The combination of better than anticipated economic data and the continued hope that the Fed will lower interest rates at some point this year added fuel to already overheated equity market prices. Last quarter, I wrote at length about the expensiveness of most US stocks and the effects on future returns. Suffice to say, with the performance of most markets being positive so far this year, our concerns surrounding high valuations have not changed. The current rally we are witnessing in the S&P 500 has created the following conditions: the price is more than 13% above its 200-day moving average, with more than 85% of members trading about their own 200-day moving average, the Price / Sales ratio (valuation) to the VIX (complacency) at multi-year highs (h/t John Hussman), and household allocations to stocks and their feelings about future prospects at extreme levels. The charts on the right show these conditions going back to 1998. As you can see, this does not always signal a market correction, but it has been a precursor to some of the larger drawdowns we have seen over the last 25 years. So, if there is one word I could use to describe the environment in the short term it would be “Exhausted.” One silver lining during the quarter is that participation improved in February and March, meaning that the market was not being driven by just a small group of stocks, as we witnessed over much of 2023. It is too early to tell if this is a change in trend, but it would be a much healthier environment in which to take more risk if participation wasn’t as ragged, even when considering current high valuations. Inflation and Interest RatesTo start the year, capital markets were pricing in close to seven rate cuts from the Fed, based on belief that inflation has been controlled, so restrictive monetary policy was not needed. I mentioned that I thought that was overly optimistic, based on what the inflation data was signaling. Over the last three months, inflation data has come in higher than what markets were estimating. This has changed expectations for rate cuts to come down to under three this year, with cuts not anticipated to begin until later in the year. The bond market has taken notice, as the long end of the US treasury curve has moved higher in anticipation of interest rates staying higher for longer. The current trend in inflation data being released might make even three cuts overly optimistic. The trend in CPI, Core PCE (Personal Consumption), and the prices paid component of the ISM manufacturing survey, all point to inflation being stickier and more permanent than what the market was anticipating starting the year. If inflation does become more embedded in the economy, the effects would be widespread across capital markets. Operating margins for the S&P 500 have maintained a high level, despite higher inflation, on the belief that inflation would moderate, and input costs and end prices would come back down. Inflation remaining sticky is going to test companies’ ability to continue to suppress wages and push higher prices down to the consumer. If the consumer is unable or unwilling to absorb continuously higher prices, margins will compress to more normal levels. Our job is to navigate this challenging environment and build portfolios that protect against the risks we observe, while earning a return to meet long term goals. To help protect our portfolios against margin compression and inflation risk, our analysis of companies looks at the ability of a company to maintain pricing power and the ability to adjust cost structures based on changing market dynamics. We also run scenario analysis on the operating performance of a company to make sure the price we are paying has a wide margin of safety built in. When looking at other asset classes to complement the portfolio companies we own, our understanding of market history and valuations provides the framework to take advantage of opportunities and avoid unnecessary risks when prices do not reflect economic reality. I look forward to the day when we talk about the breadth of opportunities and how the cash positions in the portfolio are being deployed to take advantage of them. In the meantime, we continue to have a neutral stance, and hold more cash than normal due to high valuations, euphoric sentiment, and ragged market participation. When the data changes, we will change our mind. Thank you for your continued trust and please do not hesitate to reach out to me to discuss any topic in greater detail. —Patrick Mason Thanks, Patrick!
Have a safe and happy spring! Tim Mosier, President Cairn Investment Group, Inc. |


 RSS Feed